November 2020 Update:
An October 2020 article in the Physics Today magazine highlighted the record high water levels experienced across the Great Lakes region in recent years and the impacts that it had on homeowners in lakefront communities. That article provides useful context for the report below and is available for download below or through the Physics Today website (https://doi.org/10.1063/PT.3.4589).
A PDF version of the report can be found here. This article is reproduced with the permission of the American Institute of Physics.
2022 Water Levels
Updated September 2022.
Introduction:
This is an update to the May 2022 report of water levels in the Saugatuck and Douglas harbor area. Water levels in Saugatuck and Douglas have continued to recede toward the long-term average, having dropped significantly from the record high levels observed in summer 2020. The mean August 2022 water level (580.02 ft. msl) is approximately 25 inches below the summer 2020 peak, 9 inches below the August 2021 water level, and 8 inches higher than the long term mean August elevation. The lake level forecast provided by the US Army Corps of Engineers (USACE) indicates that the water level will decline through the next six months as part of the typical seasonal cycle, likely remaining above the long-term average but well below the record levels observed in 2020. This report will summarize the current state of the lake levels and look ahead to the forecasted levels, but note the predictions on future lake level are educated guesses by NOAA and USACE scientists and engineers based on modeling Mother Nature.
First Point to reemphasize:
Kalamazoo Lake and Lake Michigan are hydrostatically connected! This means that as Lake Michigan rises, so does the Kalamazoo Lake and River. Kalamazoo Lake is what is referred to as a drowned river mouth.
Historical Lake Levels:
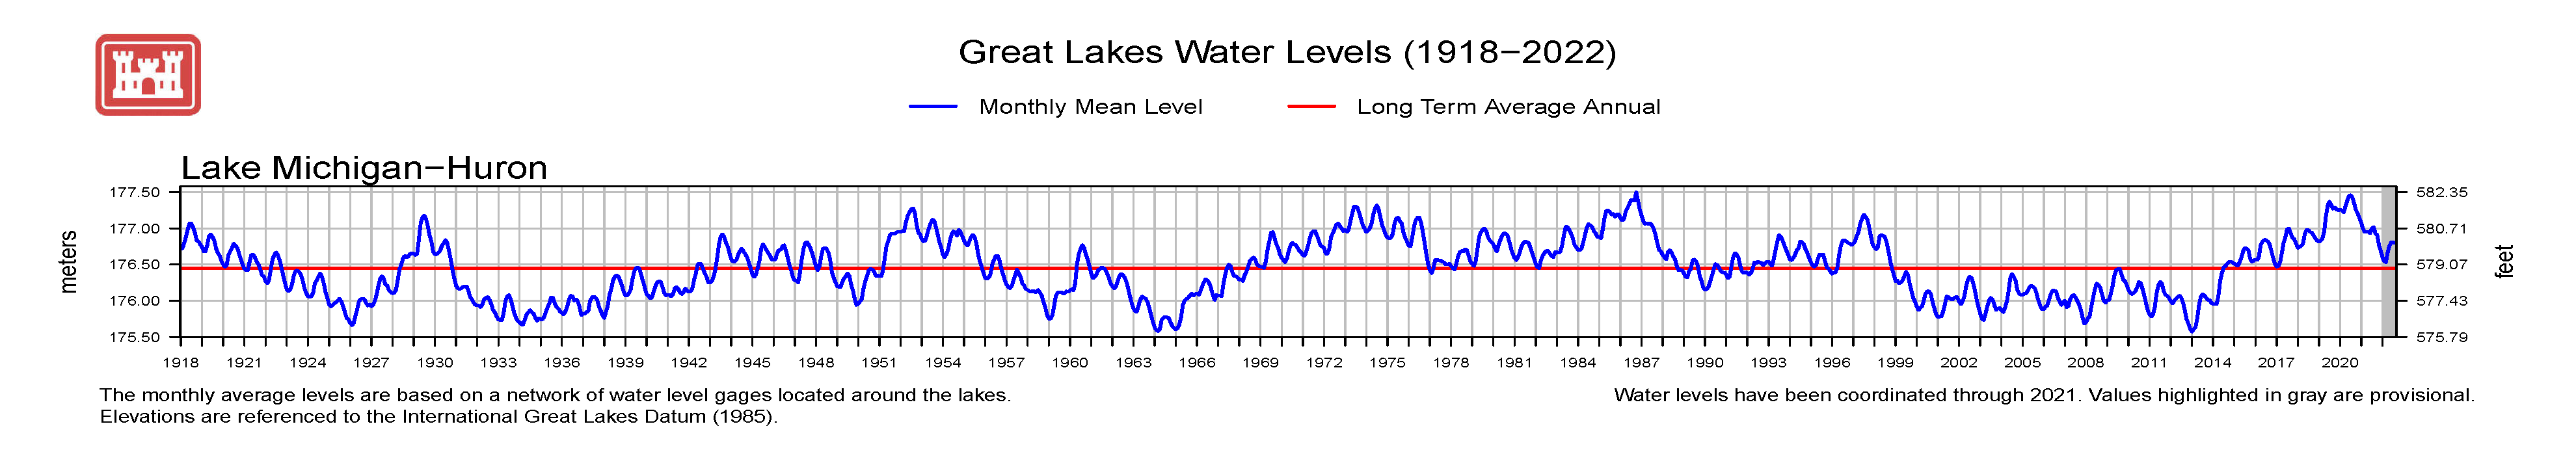
Let’s again look at the updated historical Lake Michigan water levels going back to the year 1918 (Figure 1). As discussed in prior reports, Lakes Michigan and Huron are also hydrostatically connected by the Straits of Mackinac. The time history in Figure 1 shows at least six periods of high water and five low water level events, with a near record low occurring in 2013 (remember all the dredging concerns). Some modelers see a periodicity in high to low water levels of eight to fifteen years, but suffice to say the water level goes up and it goes down at least each decade. If we examine the length of high water events during the entire record we observe high water events as short as one year and as long as approximately eight years. The average duration of high water events is approximately four years. After an approximately eight year high water event, it appears that Lake Michigan water levels are now trending downward. Good news.
Figure 2 shows in more detail the mean monthly water levels from 2021 and 2022 relative to the historic maximum, minimum, and mean water levels. After water levels reached a record high in July-August 2020 (~582.4 ft. msl, 7.3 inches higher than the previous maximum), the water has steadily declined to a mean August level of approximately 580.02 ft. msl. This is down over 2 feet from the record highs of 2020, and 9 inches from the mean August 2021 levels, but still approximately 8 inches higher than the long term August mean.
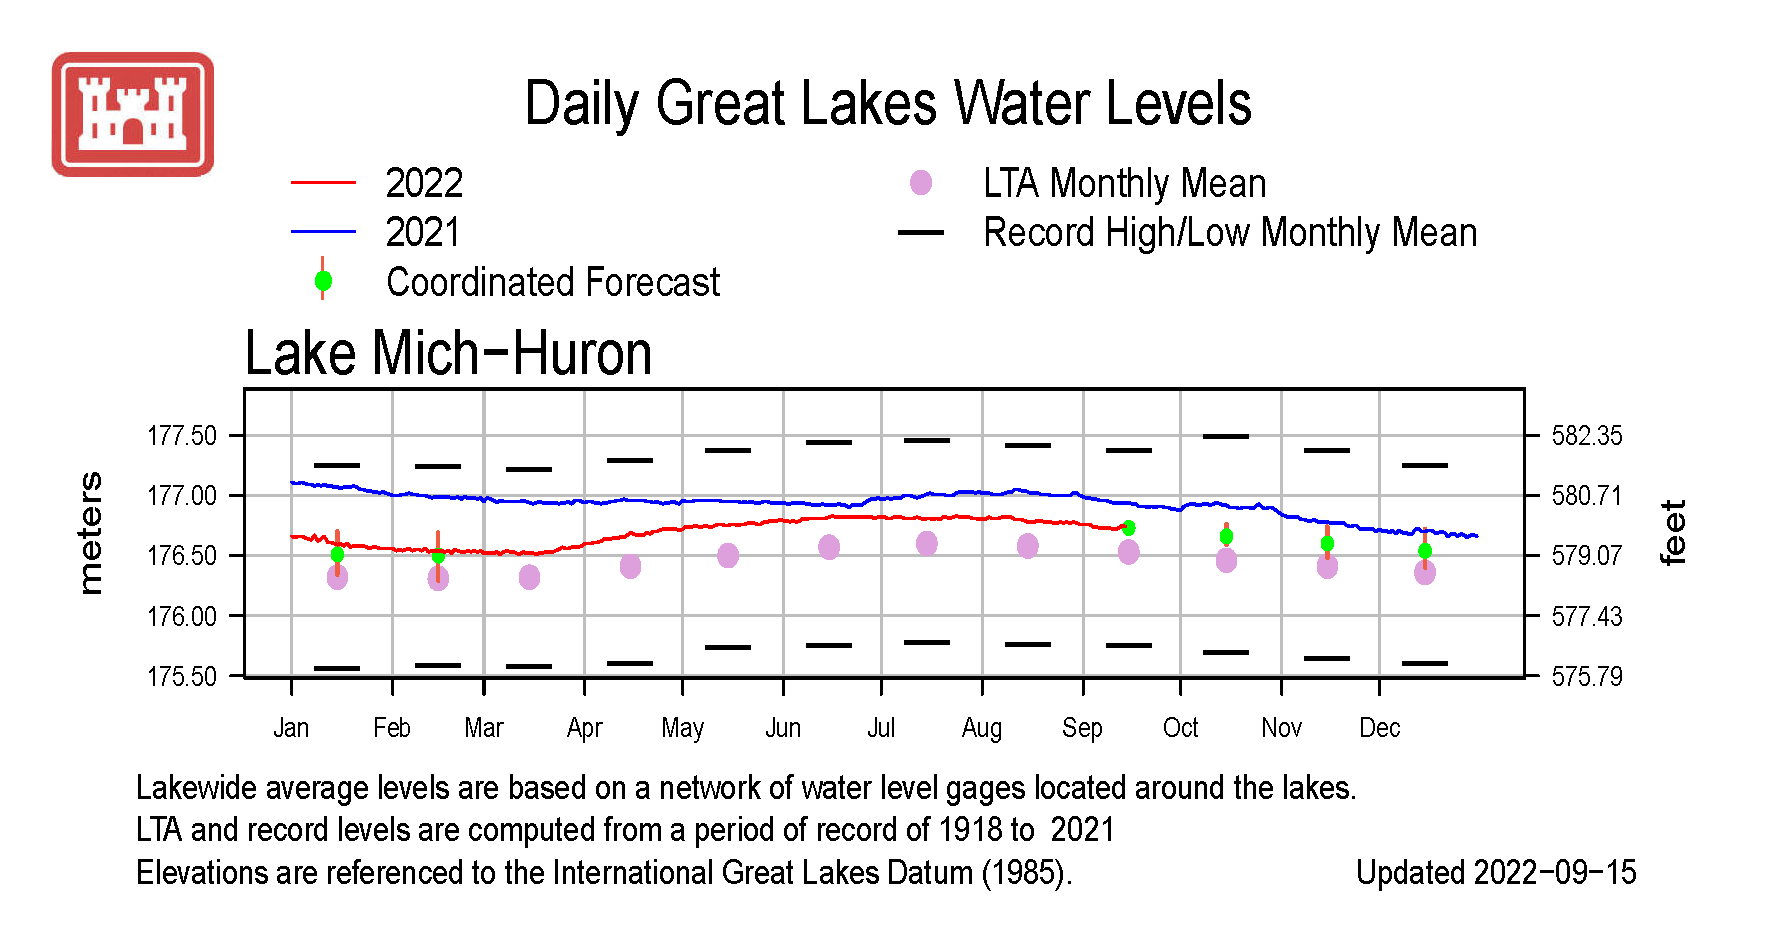
The top of the seawall at East Shore Harbor Condos (ESHC) is at approximately 582 ft. msl, thus any Lake Michigan water level above 582 ft results in flooding. The 582 ft. msl is representative of the height of other seawalls in the areas, thus if there is flooding at ESHC flooding will be occurring in other parts of the harbor. The mean daily water level for Lake Michigan exceeded 582 ft every day from May 20, 2020 through early September. After that point, the average monthly water level has not exceeded 581.5 ft. msl, thus no flooding. The Lake Michigan water level gauge at Holland can be easily accessed (see NOAA's water level data for Holland, MI) to ascertain whether flooding of the shore is occurring. Just remember ~582 ft. msl or lower equals no flooding.
Present Lake Level and Near Term Trends (September 2022):
Presently Lake Michigan and thus Kalamazoo Lake are at 579.86 ft. msl which is approximately 32 inches above the low water datum (LWD) value. Water level is down approximately 9 inches from the mean August 2021 level and 25 inches from the record high set in July 2020. However, the water level today is still approximately 8 inches higher than the long term average. The water level will likely decrease over the next six months before beginning to increase again in Spring 2023.
Future Lake Levels:
The US Army Corps of Engineers, NOAA, and various Canadian government organizations all monitor the water level in the Great Lakes and make predictions as to future water levels. Some predictions look a few months into the future while others predict next year or five and ten years out. For this discussion we are presenting the USACE water level forecast for a 12 month period starting from August 2022. Recall, three factors determine lake level; precipitation, evaporation, and runoff which is referred to as the Net Basin Supply (NBS).
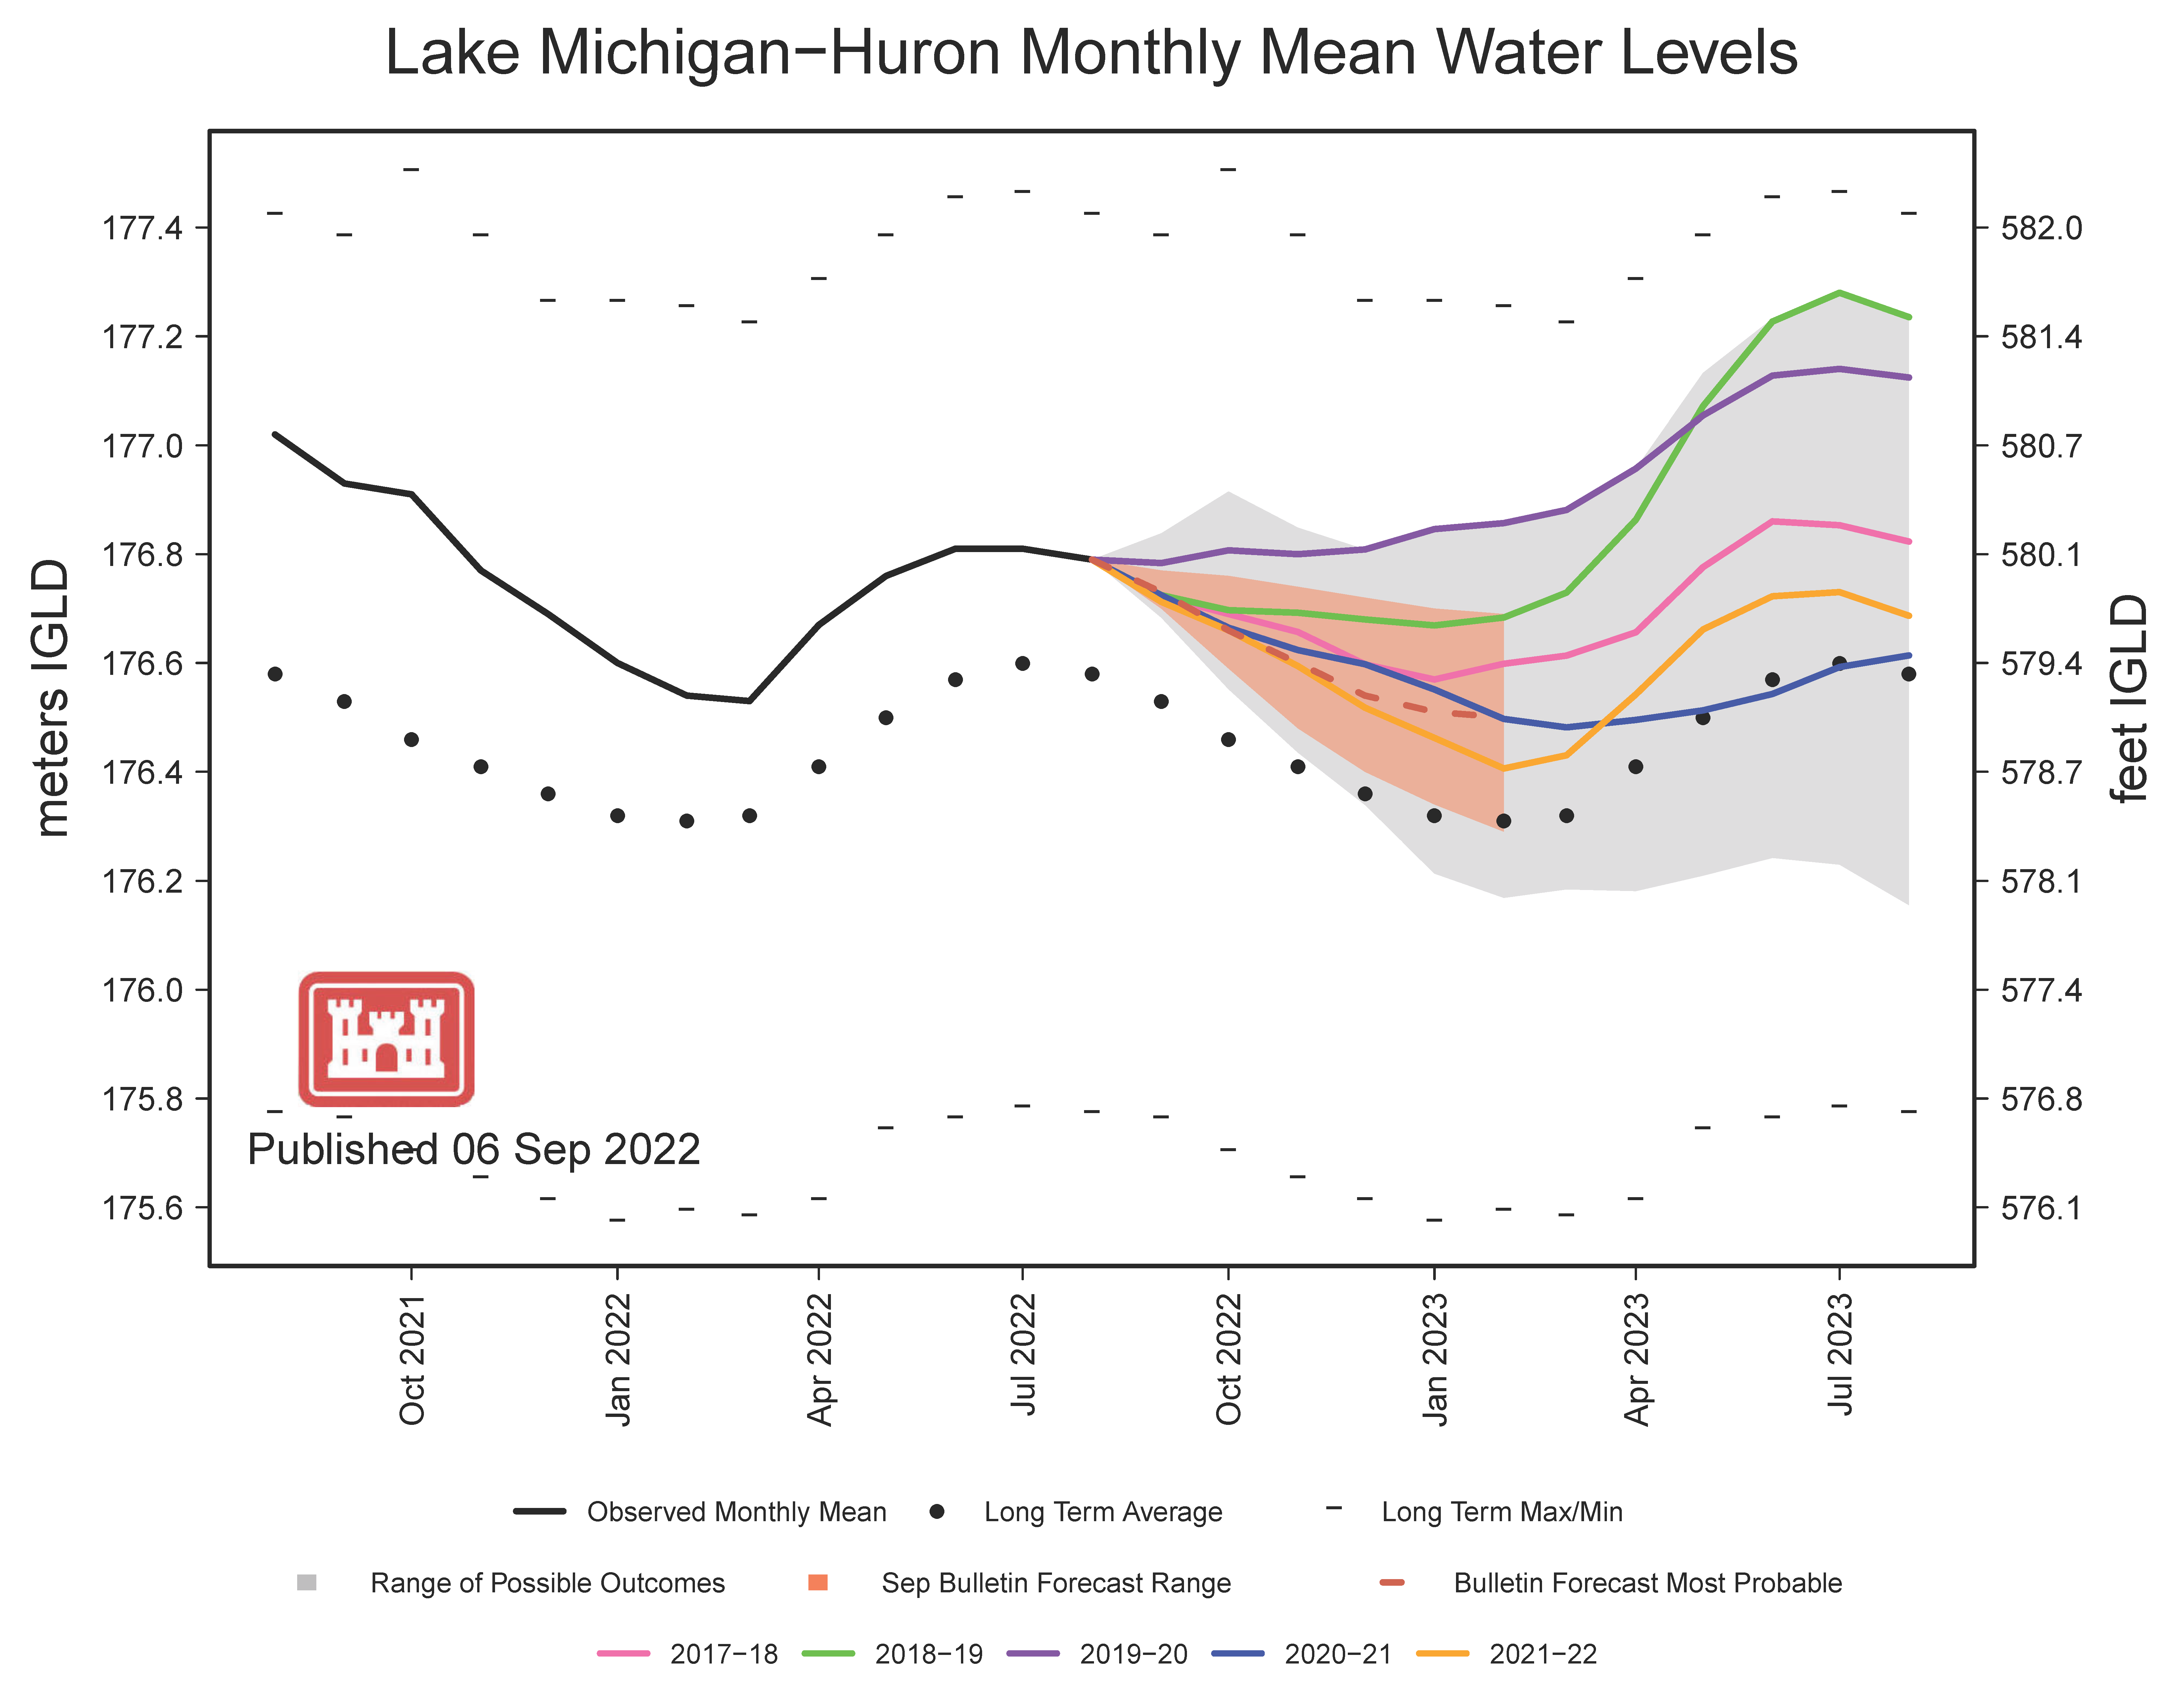
Figure 3 shows projected water levels based on a range of scenarios. The grey envelope represents the range of possible modeling scenarios based on historical data from 1900 to 2020, while the red envelope represents the more probable range of water levels over the next six months. The five solid lines represent the forecasted water levels if the water supply in the coming months is similar to what was observed in each of the last five years. If conditions remain dry like the last two years, summer 2023 water levels could continue to decline towards the long term average. However, if we experience wet conditions comparable to what was observed from 2018-2020, summer 2023 levels could increase by over 1 foot from current levels. Note that all of these projections forecast water levels below the 582 ft msl flooding threshold.
Summary:
The high water levels of 2020 created problems and large expenses for the harbor stakeholders. The question that we have not had a reliable answer for is, when if ever will the water return to normal (i.e. is near average value). It really is mostly about the precipitation and evaporation. The average annual precipitation in the Michigan watershed basin is approximately 32 inches, with a high value of 40 inches occurring in 1985 and a low of 21.6 inches in the year 2016. The annual precipitation in 2020 in the Saugatuck area was 39.2 inches, near the high, resulting in the record-breaking water levels and regional flooding. However, a comparatively dry 2021 resulted in a steep reduction in water levels. Current forecasts from NOAA’s Climate Prediction Center suggest a small likelihood of above normal temperatures in the next 3 months and equal chances of above, below, or near-normal precipitation. Depending on the precipitation levels over the next several months, summer 2023 water levels could increase toward the recently observed record levels or continue to revert toward the historical mean. The takeaways are:
- Kalamazoo Lake and Lake Michigan are hydrostatically connected, if Lake Michigan rises so does Kalamazoo Lake and River.
- Remember the number 582 ft msl. When the gauge at Holland reads 582 ft or higher we are going to get flooding.
- Storm surge and seiche events on Lake Michigan will still occur and result in local flooding due to the high water. In normal times we barely notice these occurrences.
- The future lake level is all about NBS, really it translates into rain and snow fall. Above average precipitation in the Great Lakes Basin spells trouble.
A PDF version of the report can be found here.
Prior water level reports from May 2022, November 2021, August 2021, April 2021, January 2021, July 2020, and December 2019 are also available.